Fast, affordable Internet access for all.
map
Content tagged with "map"
30 Maps About the Internet
At their core, maps are about using data to tell a story. And we may be biased, but we love a good map about the Internet around here. Hexes, polygons, availability maps: they're all equally good. Whether in service to educating the public, or making a policy point, or helping local leaders make more informed choices as they work for the collective good, maps can be a powerful tool.
Every year since 2018, mapping gurus from the United States and around the world have come together to have some fun by putting together 30 maps in 30 days. Different types of maps and conceptual frameworks invite both builders and viewers to look at the world in new ways, and have some fun along the way.
ILSR is joining in this year, and throughout the month of November we'll be releasing a new map every day showing featuring Internet infrastructure and digital equity in news ways. See the categories above.
Every day we'll publish a new map about the Internet, and post them to our StoryMaps page. The first is already live: showing mobile wireless towers in and around Phoenix, Arizona, that have been disguised to look like something else.
Got an idea for a map we should make? Email is at broadband@communitynets.org.
P.S. Maps about the Internet are nothing new: Vox collected 40 Maps About the Internet all the way back in 2014 (my favorites are numbers 8, 18, and 32).
New Resource: Our New Community Network Map Shows the Explosion of Publicly Owned Networks
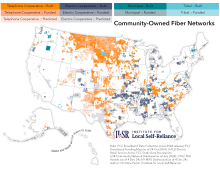
In 2011, we built our first map showing where community-owned networks were located across the United States. At the time, it aimed to illustrate what we knew to be true: that more than 100 communities were choosing to fill the local broadband marketplace by building and/or operating their own networks.
The goal was twofold: to highlight the work local governments were doing to fix the broken broadband market in their communities, and collect in one place the breadth, depth, and variety of community-owned networks. Over time, we added Tribal networks, and those operated by telephone and electric cooperatives.
Today we release a new version of our Community Networks Map, showing where municipal networks operate across the United States and how they are bringing new, more affordable service and competition to communities around the country. From 130 networks covering a similar number of communities in 2011, the new map shows that municipally owned Internet service providers now total more than 400 networks covering more than 700 communities. A third of those networks provide high-speed Internet access to nearly every address in the communities where they are located.
Gaming the FCC's 10-day Rule, Competition on Open Access Networks, and Letters of Credit | Episode 76 of the Connect This! Show
Join us Tuesday, July 25th at 2pm ET for the latest episode of the Connect This! Show. Co-hosts Christopher Mitchell (ILSR) and Travis Carter (USI Fiber) will be joined by regular guests Doug Dawson (CCG Consulting) and Kim McKinley (UTOPIA Fiber) to talk about all the recent broadband news that's fit to print.
Email us at broadband@communitynets.org with feedback and ideas for the show.
Subscribe to the show using this feed or find it on the Connect This! page, and watch on LinkedIn, on YouTube Live, on Facebook live, or below.
IN OUR VIEW: Friday the 13th Mapping Challenge Deadline Highlights Failed Process
Last Friday was a major milestone in the process of moving $42.5 billion from the federal government to states to distribute mostly to rural areas to build new, modern Internet access networks. January 13th marked the deadline for error corrections (called challenges) to the official national map that will be used to determine how much each state will get.
As an organization that has worked in nearly all 50 states over the past 20 years on policies to improve Internet access, we spent the last few weeks struggling to understand what was actually at stake and wondering if we were alone in being confused about the process. Despite the stakes, almost no expert we talked to actually understood which challenges – if any – would fix errors in the map data before it was used to allocate the largest single federal broadband investment in history.
Update: On January 13th, Joan Engebretson confirmed in Telecompetitor that the location challenges deadline was October 30, 2022, and not Jan 13, 2023.
This article will explore what is going wrong with the distribution of that $42.5 billion, the mapping process, and continued failure of the Federal Communications Commission (FCC) to show competence in the broadband arena. And it offers ways to fix these important problems as every jurisdiction from Puerto Rico to Hawaii feels overwhelmed by the challenge.
The $42.5 billion guarantees each state $100 million and a large additional sum calculated proportionally based on the number of locations in each state that don’t have adequate high-speed Internet service. States that already made significant investments in better rural networks and made strides toward fast universal Internet access for all households - like Massachusetts - will likely not receive much more than $100 million, while extremely large states with many high-cost rural residents - like Texas and California - will receive billions.