ILSR Launches Latest Tribal Internet Networks Census Update
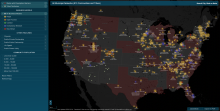
The Institute for Local Self-Reliance today released its comprehensive 2026 census of Tribal Internet networks, finding that the number of active Tribal-owned and operated broadband networks has doubled since ILSR first conducted this research in 2020 while offering a new way to interact with these networks’ stories.
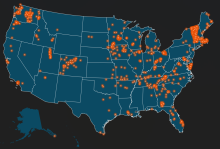
Across the country, nearly 90 Tribal nations are actively providing Internet access to their communities. These Tribes own the wires or the wireless equipment that guarantee community members can stay connected to loved ones, continue their education remotely, check in with their doctors without driving an hour each way, and stay engaged in the social civic life of their communities.
This number underscores a period of massive growth in the last ten years among Tribal broadband owners.
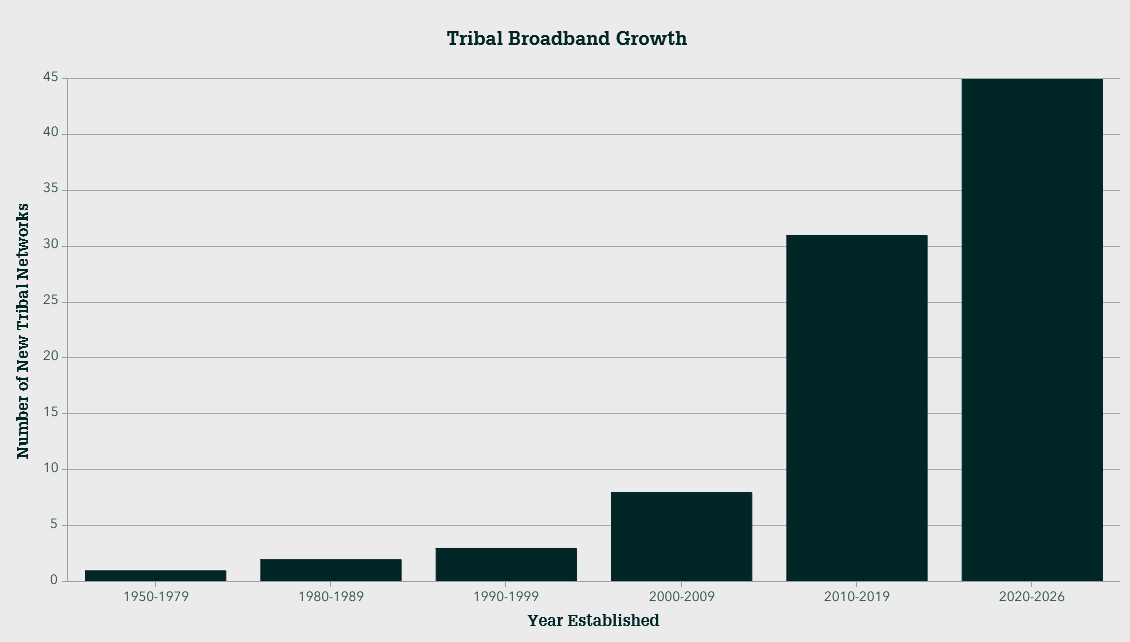
Nor is that growth over. Our research also located about 50 Tribal nations that are building or have received funding to build networks, and another few dozen that have expressed interest in bringing Internet access to their communities. Over the next decade, the ranks of Tribal broadband owners may well double again.