Image


Fast, affordable Internet access for all.
Old /tags-176

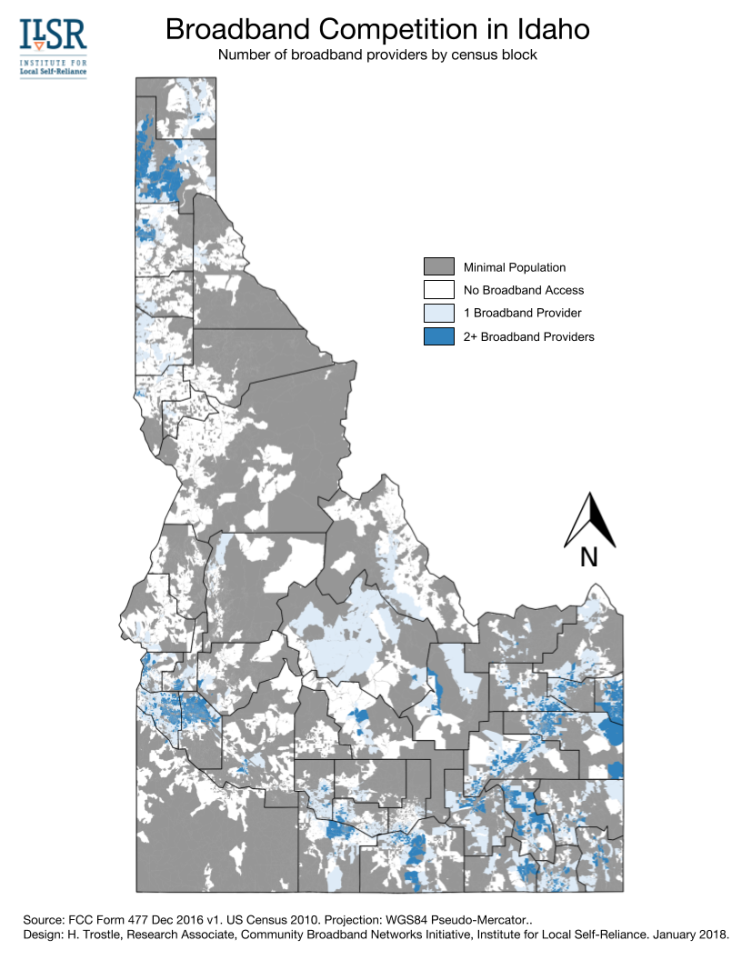
Like many other states, connectivity across Idaho is unequally distributed. Urban areas may have a choice of one or two broadband providers while many rural areas have no options whatsoever. We have compiled the latest data from December 2016 into a map to highlight competition and show these disparities.
According to the Federal Communications Commission's (FCC) 2018 Broadband Progress Report, 98 percent of urban areas and 68 percent of rural areas in Idaho have broadband service, defined by the FCC as 25 Megabits per second (Mbps) downstream and 3 Mbps upstream. While about 1 million people in Idaho have access to two or more options, nearly half a million people are not nearly as lucky. Approximately 327 thousand of the state's 1.683 million people have only one option for broadband service, and 169 thousand still do not have access to broadband. This, however, is actually a best-case scenario.
Image
Failures In Broadband Data
These statistics and this map, like most broadband data, rely on FCC Form 477. Internet Service Providers (ISPs) complete the form explaining which census blocks they serve or could serve. Census blocks are the smallest unit of measurement for the U.S. Census, and they vary in size. Rural census blocks often cover more land mass than urban areas. ISPs need only be able to offer service to one person in a census block in order to claim the entire census block. This can lead to an overstatement of how many people are actually served. The FCC launched an interactive map with this data, and FCC Commissioner Jessica Rosenworcel has invited people to submit corrections to broadbandfail@fcc.gov.

The U.S. Department of Housing and Urban Development (HUD) provided Community Development Block Grant funds (CDBG) to West Virginia as in other states. This year, the Community Development Division of the West Virginia Development Office that distributes CDBG funds will provide $1.5 million to local broadband projects that include planning and infrastructure.
Big Demand
Last July, the state’s Development Office announced that it would accept applications for broadband projects. The decision was a departure from past practice of focusing only on water and sewer infrastructure. By the time the application period was closed, 12 potential projects had been submitted for consideration; those projects touch 27 counties and reach about 300,000 premises, many located in the southern part of the state.
All twelve projects will receive some amount of CDBG funding.
One of those applications was from the Region 4 council, in the hopes of obtaining $125,000 for planning to improve connectivity in Webster, Fayette, Greenbrier, Nicholas, and Pocahontas Counties. The state will provide the funding, which will potentially affect future planning for six more counties. Region 4 will collaborate with a similar initiative by Region 1, which will also receive $125,000.
Another multi-organizational application came from Clay County, which plans to work with Calhoun and Roane Counties on a feasibility and business plan on how best to move forward to improve connectivity. Fayette County wants to use its award to map out where best to place fiber for maximum effect and Gilmer County will focus on planning to involve a local industrial park along with exploring other funding strategies.
Early last year, Connect Your Community and the National Digital Inclusion Alliance released a well-researched and compelling case that AT&T had engaged in digital redlining of Cleveland, refusing to upgrade Internet access to neighborhoods with high poverty rates. In episode 290 of the Community Broadband Bits podcast, we check in to learn more and discuss key lessons.
Angela Siefer, executive director of NDIA, and Bill Callahan, President and Director of Connect Your Community in Cleveland, explore what is happening both in Cleveland and other metro centers where low-income residents are often over-paying for services far slower than are available in higher-income neighborhoods.
This discussion covers important ground, not just describing the problem but discussing how the easiest solution (forcing AT&T to upgrade areas it has neglected) is not sufficient. Also, there is sports talk at the beginning but then the host gets himself under control and focuses on what is important in this conversation.
This show is 35 minutes long and can be played on this page or via Apple Podcasts or the tool of your choice using this feed.
Transcript below.
We want your feedback and suggestions for the show-please e-mail us or leave a comment below.
Listen to other episodes here or view all episodes in our index. See other podcasts from the Institute for Local Self-Reliance here.
Thanks to Arne Huseby for the music. The song is Warm Duck Shuffle and is licensed under a Creative Commons Attribution (3.0) license.
The FCC collects data from Internet Service Providers that reflects census blocks where they offer service to at least one premise. Currently, the Commission does not collect information about rates subscribers pay. A new report from the Berkman Klein Center dives into prices subscribers pay and also looks at trends from national companies as well as local publicly owned networks. The report, Community-Owned Fiber Networks: Value Leaders in America, supports what we’ve always found — that publicly owned networks offer the best all around value for the communities that make the investment. Download the report.
In the Abstract, authors David Talbot, Kira Hessekiel, and Danielle Kehl describe their approach:
We collected advertised prices for residential data plans offered by 40 community-owned (typically municipally owned) Internet service providers (ISPs) that offer fiber-to-the-home (FTTH) service. We then identified the least-expensive service that meets the federal definition of broadband—at least 25 Mbps download and 3 Mbps upload—and compared advertised prices to those of private competitors in the same markets. We found that most community-owned FTTH networks charged less and offered prices that were clear and unchanging, whereas private ISPs typically charged initial low promotional or “teaser” rates that later sharply rose, usually after 12 months. We were able to make comparisons in 27 communities. We found that in 23 cases, the community-owned FTTH providers’ pricing was lower when averaged over four years. (Using a three year-average changed this fraction to 22 out of 27.) In the other 13 communities, comparisons were not possible, either because the private providers’ website terms of service deterred or prohibited data collection or because no competitor offered service that qualified as broadband. We also made the incidental finding that Comcast offered different prices and terms for the same service in different regions.

The FCC collects data from Internet Service Providers that reflects census blocks where they offer service to at least one premise. Currently, the Commission does not collect information about rates subscribers pay. A new report from the Berkman Klein Center dives into prices subscribers pay and also looks at trends from national companies as well as local publicly owned networks. The report, Community-Owned Fiber Networks: Value Leaders in America, supports what we’ve always found — that publicly owned networks offer the best all around value for the communities that make the investment.
Download and read the full report here.
In the Abstract, authors David Talbot, Kira Hessekiel, and Danielle Kehl describe their approach:
We collected advertised prices for residential data plans offered by 40 community-owned (typically municipally owned) Internet service providers (ISPs) that offer fiber-to-the-home (FTTH) service. We then identified the least-expensive service that meets the federal definition of broadband—at least 25 Mbps download and 3 Mbps upload—and compared advertised prices to those of private competitors in the same markets. We found that most community-owned FTTH networks charged less and offered prices that were clear and unchanging, whereas private ISPs typically charged initial low promotional or “teaser” rates that later sharply rose, usually after 12 months. We were able to make comparisons in 27 communities. We found that in 23 cases, the community-owned FTTH providers’ pricing was lower when averaged over four years. (Using a three year-average changed this fraction to 22 out of 27.) In the other 13 communities, comparisons were not possible, either because the private providers’ website terms of service deterred or prohibited data collection or because no competitor offered service that qualified as broadband. We also made the incidental finding that Comcast offered different prices and terms for the same service in different regions.
Update 12/22/2017: Original maps generated on December 11th and used for these fact sheets understated the population of Americans forced to obtain services from known network neutrality violators. The problem is even greater than we originally calculated. We've update our maps and our fact sheets to reflect the more accurate data.
Network neutrality protects Americans from the ability of powerful ISPs to exercise unchecked power over what subscribers access and how quickly they receive certain content. The neutral characteristic of the Internet is one of its finest qualities. If Republican FCC Commissioners and Chairman Ajit Pai vote to shred network neutrality on December 14th as they’ve indicated, 177 million Americans will be left to the whims of a flawed market.
Mapping It Out, Presenting The Fact (Sheets)
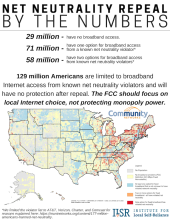
We recently presented visualizations based on FCC Form 477 data that supports our findings on the way the repeal will limit vast swaths of people to a bleak Internet access future. Nationwide, approximately 29 million people have no broadband Internet access. Another 129 million will have no ability to change Internet access providers because there is no other option. Out of those folks, 48 million are forced to take service from an ISP that is a known network neutrality violator. Likewise, 146 million may have a choice between two ISPs, but about 52 million must choose between two network neutrality violators that have actively worked to undermine the policy for years.
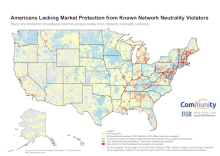
Our team also parsed out the numbers for California and the East Coast from Maine to Virginia. The results are just as discouraging.
In our fact sheets, we focused on the number of people who either have no broadband access or who will be forced to take service from a firm that is a known violator of network neutrality. We've included our maps to help illustrate just how pervasive this problem is in each region.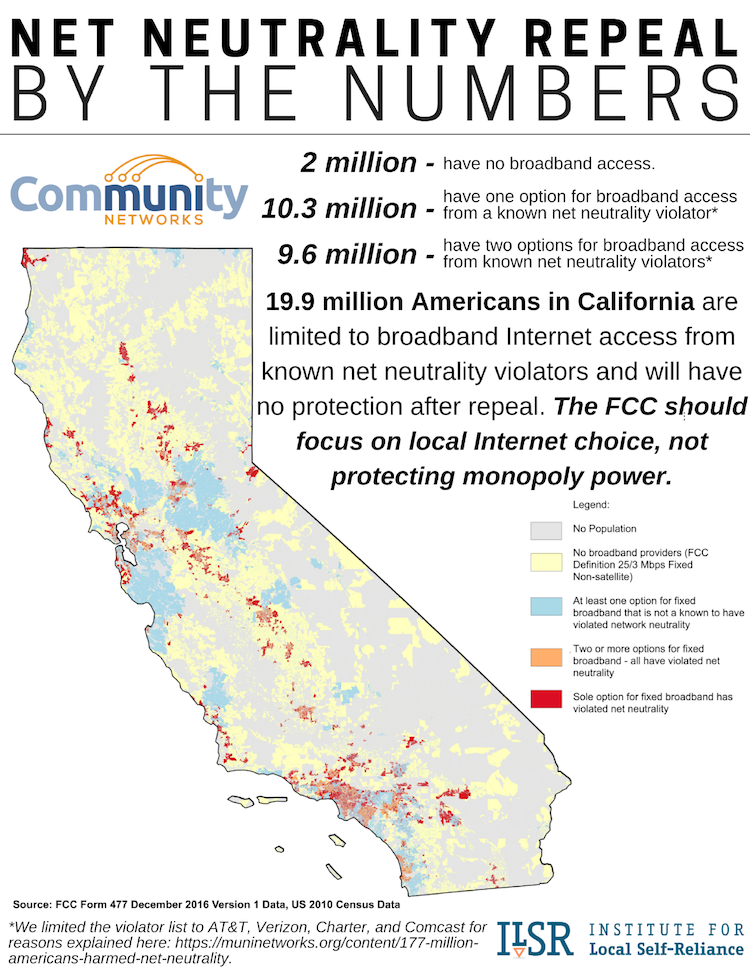
Update 12/20/2017: Original maps generated on December 11th understated the population of Americans forced to obtain services from known network neutrality violators. The problem is even greater than we originally calculated, particularly in New York. End update.
This Thursday, December 14th, the FCC plans to remove network neutrality protections. Republican Commissioners and Chairman Ajit Pai justify the decision by claiming that the market will naturally protect subscribers from predatory big ISP behavior. Unfortunately, the FCC’s own numbers disprove their theory. We dug into the data that reveals how 177 million Americans will be left without any market protection following net neutrality repeal.
Visualizing The Data
Using FCC 477 data, we created a visualization of relevant data. This map focuses on the people and businesses at greatest risk - where they are limited to options from providers that have violated network neutrality in the past or have admitted the plans to violate it in the future.
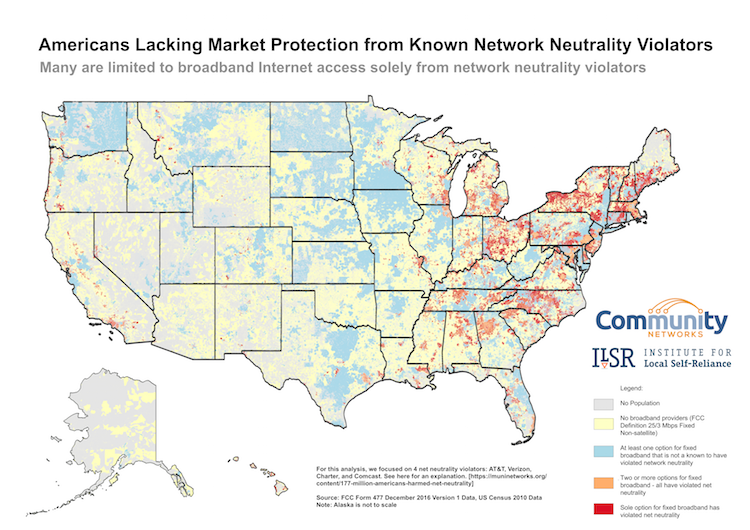
For a larger image, download this version [18 MB png].
Download Net Neutrality Repeal By The Numbers, U.S.A. Edition, fact sheet here.
The results are not inspiring. More than 129 million people are limited to a single provider for broadband Internet access using the FCC definition of 25 Mbps download and 3 Mbps upload. Out of those 129 million Americans, about 52 million must obtain Internet access from a company that has violated network neutrality protections in the past and continues to undermine the policy today.
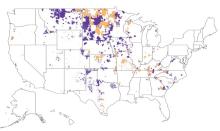
Rural communities across the United States are already building the Internet infrastructure of the future. Using a 20th century model, rural America is finding a way to tap into high-speed Internet service: electric and telephone cooperatives are bringing next-generation, Fiber-to-the-Home (FTTH) networks to their service territories. This policy brief provides an overview of the work that cooperatives have already done, including a map of the cooperatives' fiber service territories. We also offer recommendations on ways to help cooperatives continue their important strides.
Download the policy brief, Cooperatives Fiberize Rural America: A Trusted Model For The Internet Era here.
This report has been updated since we originally published it in 2017. More recent versions of the report can be accessed from the Reports Archive Page.
Key Facts & Figures
Farmers first created utility cooperatives because large private companies did not recognize the importance of connecting rural America to electricity or telephone service. Now, these cooperatives are building fiber infrastructure.
Almost all of the 260 telephone cooperatives and 60 electric cooperatives are involved in fiber network projects. As of June 2016, 87 cooperatives offer residential gigabit service (1,000 Mbps) to their members.
Rural cooperatives rely on more than 100 years of experience. The cooperative approach does not stop with rolling out rural infrastructure, but ensures that their services remain viable and affordable.
The majority of Montana and North Dakota already have FTTH Internet access, thanks to rural cooperatives. Even one of the poorest counties in the country (Jackson County, Kentucky) has FTTH through a telephone cooperative.
If you live in western North Carolina and struggle with the lack of quality Internet access, the Southwestern Commission — a council of local governments for the region’s seven westernmost counties — in cooperation with the MountainWest Partneship are urging residents to take this survey. Counties in the council include Haywood, Swain, Jackson, Macon, Graham, Cherokee, and Clay.
The goal is to quantify the demand for Internet regionally, focusing on individual counties as opposed to census blocks, in order to better determine accessibility issues. It’s an important process to show Internet providers that there is demand, debunking ISPs claim that rural demand for high-speed Internet doesn't justify the investment. Better data can also establish a foundation for future funding opportunities.
Sarah Thompson, the executive director of the council explained,
It’s really in my opinion one of the most important parts of the process. You’re basically showing [internet service providers] that there is demand, it’s showing even when there is service it’s subpar. In order to move forward with projects, we have to have that data to back up the need. To show that there are opportunities.
FCC’s Inaccurate Data Collection
Through the FCC’s form 477 data collection efforts, the Commission attempted to carry out these crucial first steps in showing aggregate demand and problematic broadband service. The data was compiled into the easily accessible National Broadband Map.
Data is collected from ISPs and it provides information to the FCC based on which census blocks ISPs serve. The problem is that this data exaggerates where coverage is available in rural areas where census blocks can be very large. Areas that may appear on the FCCs maps to be served or to be served with better connectivity are often in reality not served or served with Internet access much slower than FCC mapping indicates. Because state and federal entities typically award grants and loans to communities with the greatest need first, incorrect mapping eliminates rural communities from funding opportunities when they need it the most.
This fall, nonprofits and other organizations with an interest in constructive broadband policy have worked to help the new administration’s FCC through the public comment process. We’ve let readers know about opportunities to share their thoughts with the Commission and we’ve submitted comments separately and with other likeminded groups.
Modernizing the Form 477 Data Program
The Commission asked for comments on the method in which it collects data regarding where broadband is accessible. ISPs provide information to the FCC based on which census blocks they serve. We’ve often criticized this approach because it grossly overstates where coverage is available, especially in rural areas where census blocks tend to be large.
Read our ideas for improvements to the Form 477 data collection, which include obtaining more detailed geographic information, minimum and maximum speeds, and pricing information.
Connect America Funding Phase II Bidding Procedures and Program
In order to help bring better connectivity to rural areas, the FCC distributes Connect America Funds (CAF) to entities such as companies and cooperatives to build broadband infrastructure. The process involves bids from these entities. The FCC is considering changes to the current process and bidding procedures, including what types of projects qualify for funding. The Commission asked for comment after proposing a long list of possible changes.
We recently spoke with Jon Chambers of Connexon, who provided more detail about the program and offered his thoughts on CAF and the possible changes.
Read our Reply Comments, that address issues we feel need attention, including the Carrier of Last Resort guarantee, more opportunities for rural cooperatives, and our concern that the FCC will attempt to equate subpar satellite and mobile broadband with high-quality connectivity. We filed our Reply Comments with Public Knowledge, Appalshop, and a long list of other organizations concerned about Internet access in rural America.