As the municipal broadband movement continues to gain momentum, we created a new fact sheet to highlight the dramatic surge in the number of communities building publicly-owned, locally controlled high-speed Internet infrastructure over the last three years.
In January, we announced our updated tally of municipal broadband networks across the U.S., which showed that between January 2021 and January 2024 at least 47 new municipal networks had been lit up for service.
Our census of new municipal broadband networks comes while dozens of other projects are still in the planning or pre-construction phase, which includes the possibility of building 40 new municipal networks in California alone.
The new fact sheet not only contains pertinent numbers to illustrate the rising tide of municipal broadband networks, it also includes snapshots of four recently launched networks now providing service to communities hungry for high-quality Internet connectivity and competitive choice.
You can find the new Rising Tide of Municipal Broadband fact sheet here.

Community Broadband Resource Pairing
Among the many community broadband-related fact sheets we have created over the years, the new one pairs well with another fact sheet that spotlights a variety of more established municipal broadband networks that were in operation years before the newer networks came online.
The new fact sheet also comes on the heels of the American Association for Public Broadband (AAPB) newly released guidebook – “Own Your Internet: How To Build A Public Broadband Network” – published in partnership with the Benton Institute for Broadband & Society.
With the recent launch of a webinar series on building public broadband networks, the AAPB guidebook is tailored to help local officials navigate the logistical, technical, financial, and political challenges involved. You can find the guidebook here.
Mapping The Movement
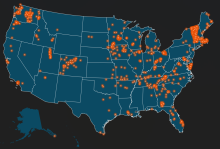
As a bonus, below is a map our GIS and Data Visualization Specialist Christine Parker created that pinpoints where the nearly 450 municipal networks now in operation are located across the nation.
Several things to consider in viewing the map: it shows municipal broadband networks only. It does not reflect the growing number of cooperatives, nonprofit organizations, and Tribal nations who have built community broadband networks.
In looking at individual states, note that a few years ago Vermont would have only had one dot on the map. Today, the state is covered with orange pins, reflecting the success the Green Mountain State has had over the past few years establishing Communications Union Districts (CUDs), which are creating municipal-owned fiber-to-the-home networks all across the state.

On the other side of the country, the map shows how the state of Washington is now awash in municipal broadband thanks to the state’s Public Utility Districts (PUDs) foray into broadband and state lawmakers rolling back a state statute that restricted PUDs from offering retail telecommunications services.
The map also reflects how Colorado has become a hotbed for municipal broadband now that lawmakers in that state got rid of counterproductive legal restrictions that were designed to protect the big monopoly incumbents from competition.
Recently, we wrote about Longmont, Colorado’s community-owned NextLight fiber network expanding beyond city limits – one of several municipal networks in the state that have garnered national recognition and have been found to outperform the spotty, high-cost offerings of the nation’s largest telcos and cable companies.